2.2

Climate : tapping into data from the past to anticipate changes in the future

Studying extreme climate events
Canicule à Paris à l’été 2012
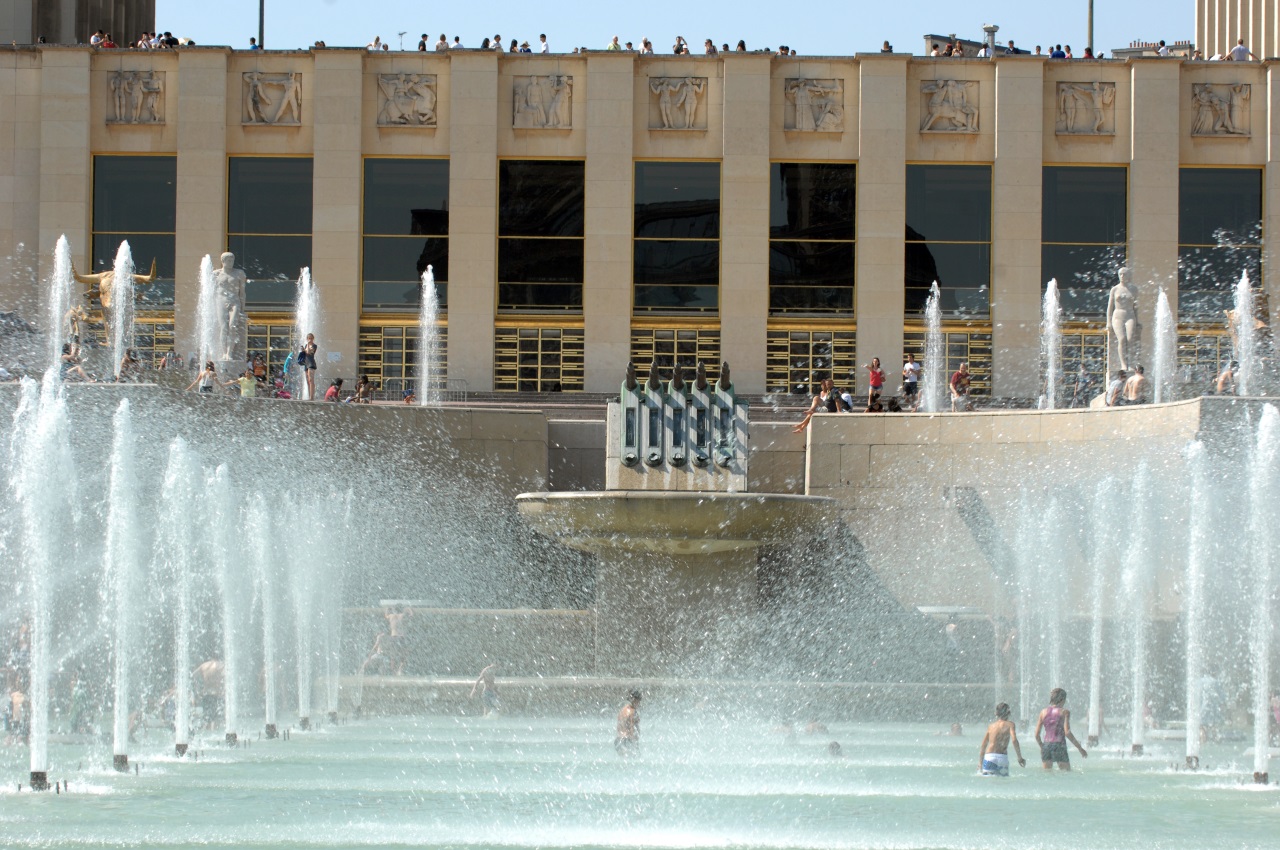
Heatwave in Paris, summer of 2012. © Météo-France, Pascal Taburet

Has the frequency with which extreme climate events occur changed over recent decades? How will it evolve in future climate scenarios? To what extent can a single extreme event be attributed to anthropogenic climate change? Completed in 2016, the EXTREMOSCOPE project aimed at advancing understanding of the links between the intensity or occurrence of extreme climate events in France and climate change.

The intense rainfall and flooding of May/June 2016 in the Seine basin and late heatwaves in the summer of 2016 were just two of the events studied under this project. The tools and assessments obtained have, for example, shown that the very hot temperatures observed from 16 August to 15 September 2016, which are more typical of severe midsummer heat waves, were altogether unprecedented at this time of year. Such an event, which had almost a zero probability of happening in the 1971-2000 climate, now has a return period in the range of a few decades and could become a common climate occurrence in the future.

The findings from EXTREMOSCOPE are intended to be integrated across all climatic services which are currently in use or being developed by the French climate research community (especially the DRIAS portal).
Analysing storms in Northern Europe through the 20th century

Taux du nombre des tempêtes par année au cours du XXe siècle
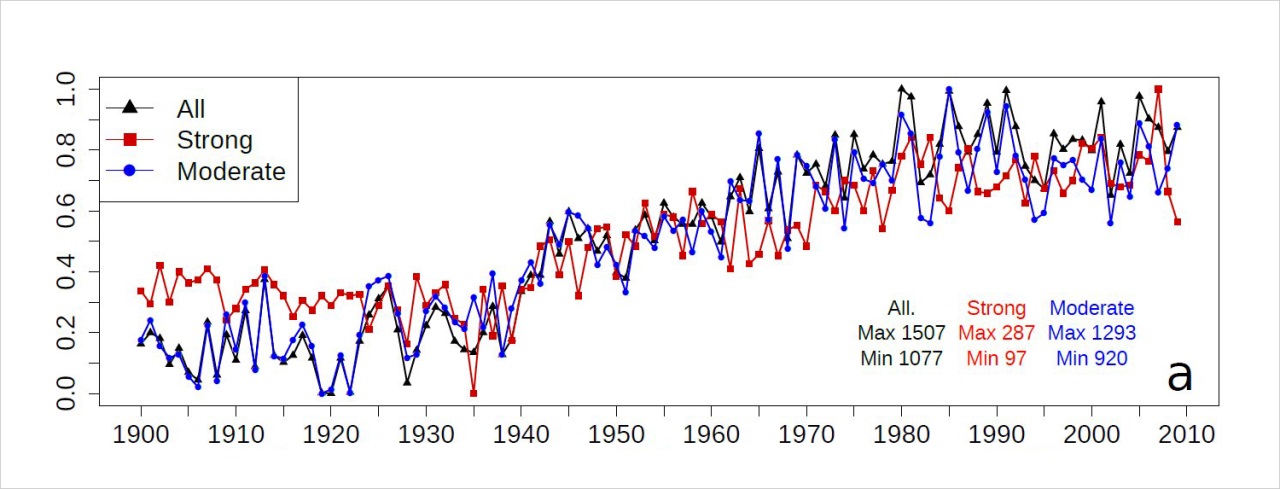
Rate of the number of storms per year over the course of the 20th century, depending on their intensity (moderate in blue, strong in red, all in black).
© Météo-France
Densité des plus fortes dépressions et tendances
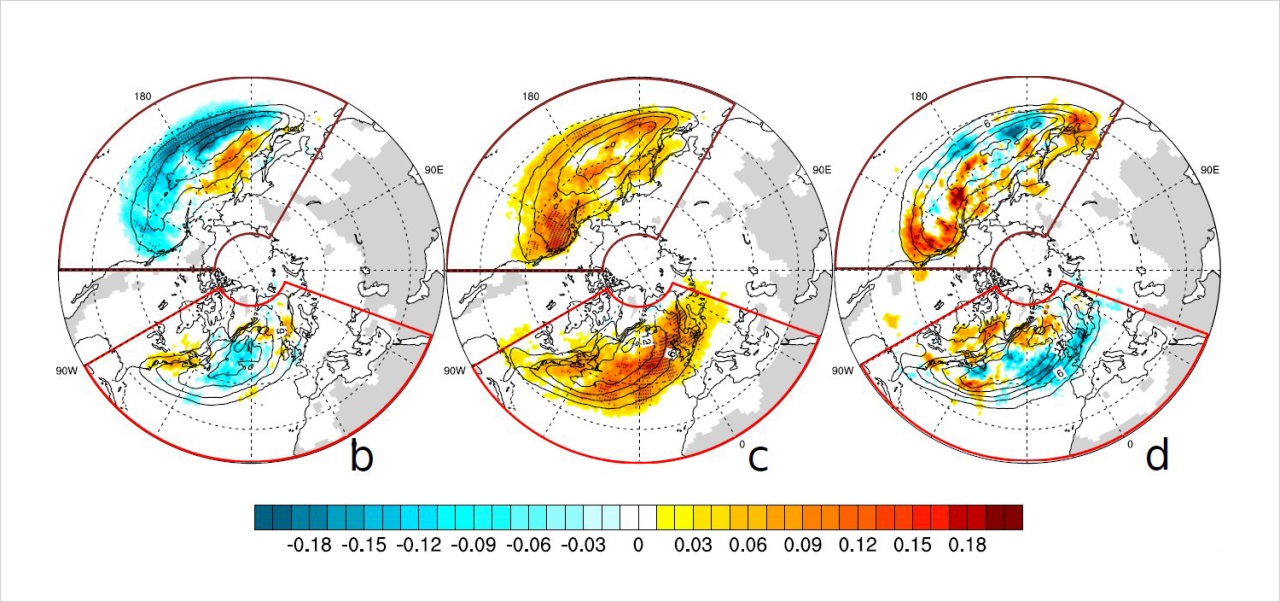
Density (black isolines) of the strongest storms and trends over the period in question (in areas of colour). Left to right: 1900-1936; 1936-1980; 1980-2009.
© Météo-France

In the context of climate change, knowing the patterns behind storms sweeping through Europe and France is of the utmost importance. A thesis jointly financed by the reinsurance company SCOR and Météo-France looked into the variability of winter storms by applying an automatic method for identifying and monitoring low pressure systems featuring in the most recent reanalysis of CEPMMT, ERA 20C. Significant multidecadal variability has come to light, with a sharp increase in the frequency of the most violent storms between 1936 and 1980, while at the turn of the century and since 1980 stagnation has been the more common trend – with major regional disparities for all that. The rise between 1936 and 1980 can be explained by a major extension in arctic sea ice and cooling of polar latitudes, since this configuration leads to greater temperature contrasts between the north and south and more intense westerly jets, which foster the emergence and growth of storms. The other two periods, characterized by a fall in the spread of sea ice and considerable warming of the polar latitudes, show fairly different results, particularly over the Atlantic basin. The most recent period – spanning 1980 to 2009 – is marked by high activity and a reduction in events over North-West Europe (to the south of the jet stream).

Storms in mainland France
On the mainland, storms are among the extreme events that have the most dramatic consequences. After Storm Xynthia in 2010, Météo-France launched an extensive climatological study programme on such phenomena, particularly with the aim of setting up a website delivering climatological data and facts on this weather event.
Up and running since the end of 2016, the platform http://tempetes.meteofrance.fr provides access to three new interactive databases listing 280 storms analysed since 1980, at a resolution of 2.5 km, 90 detailed factsheets on historic storms since 1703 and statistics on strong winds – for 70 professional weather stations which are evenly spaced out across the territory. The website also features articles on the causes of the storms, tools and methods for analysing them and their climatological characteristics in connection with climate change.

Groundbreaking meteorological datasets now available to scientists

Des données météorologiques inédites mises à disposition des scientifiques

Launched in 2012, the "Accessing climate archives" project, conducted with the French National Archives with the financial backing of the Fondation BNP-Paribas, came to a conclusion in 2016. The aim was to provide scientists with groundbreaking meteorological datasets to be able to compile new centennial series, reconstruct extreme events in the past and provide input data for climate reanalyses.

Thanks to this project it has been possible to record and analyse over a third of the French historical meteorological arsenal supplied by the climatology services since 1976, and to make these records available for consultation on the website of the French National Archives (www.siv.archives-nationales.culture.gouv.fr).

Over 650,000 images of meteorological observation tables, derived from the archives of the meteorological observations network dating back to the 19th century, have also been digitized to provide easier access to this outstanding heritage.

Developments to the model for studying water resources and impacts of drought

Météo-France has been using the hydrometeorological modelling chain SIM to simulate exchanges between the ground and the atmosphere and the change in river and groundwater levels since 2003. SIM comprises 3 interfaced modules: SAFRAN (which analyses surface meteorological parameters), ISBA (which calculates water and energy exchanges between the ground and the atmosphere and soil water content) and, finally, MODCOU (which determines the groundwater levels and the flow of the main waterways in France). In September 2016, this chain underwent a significant development when the ISBA was replaced with the SURFEX model to bring about several improvements, including better analysis of atmospheric infrared radiation, finer discretization of ground layers so as to be able to use a diffusion diagram and use of patches to simulate several types of vegetation within the same model mesh. Particular attention has been paid to terrain of varying height by simulating the effect of the sub-mesh relief effect on snow cover. Lastly, hydrogeology is now taken on board in regions where MODCOU does not simulate groundwater. These improvements to the model result in a more realistic simulation (in real time and for the past fifty years) of the soil moisture, snow cover of mountain ranges and flows of the main waterways in France.

A new version of the ARPEGE-Climate model for the next cycle of the IPCC

Précipitation moyenne (mm/jour) pour la période 1979-2008 et la saison juin-juillet-août
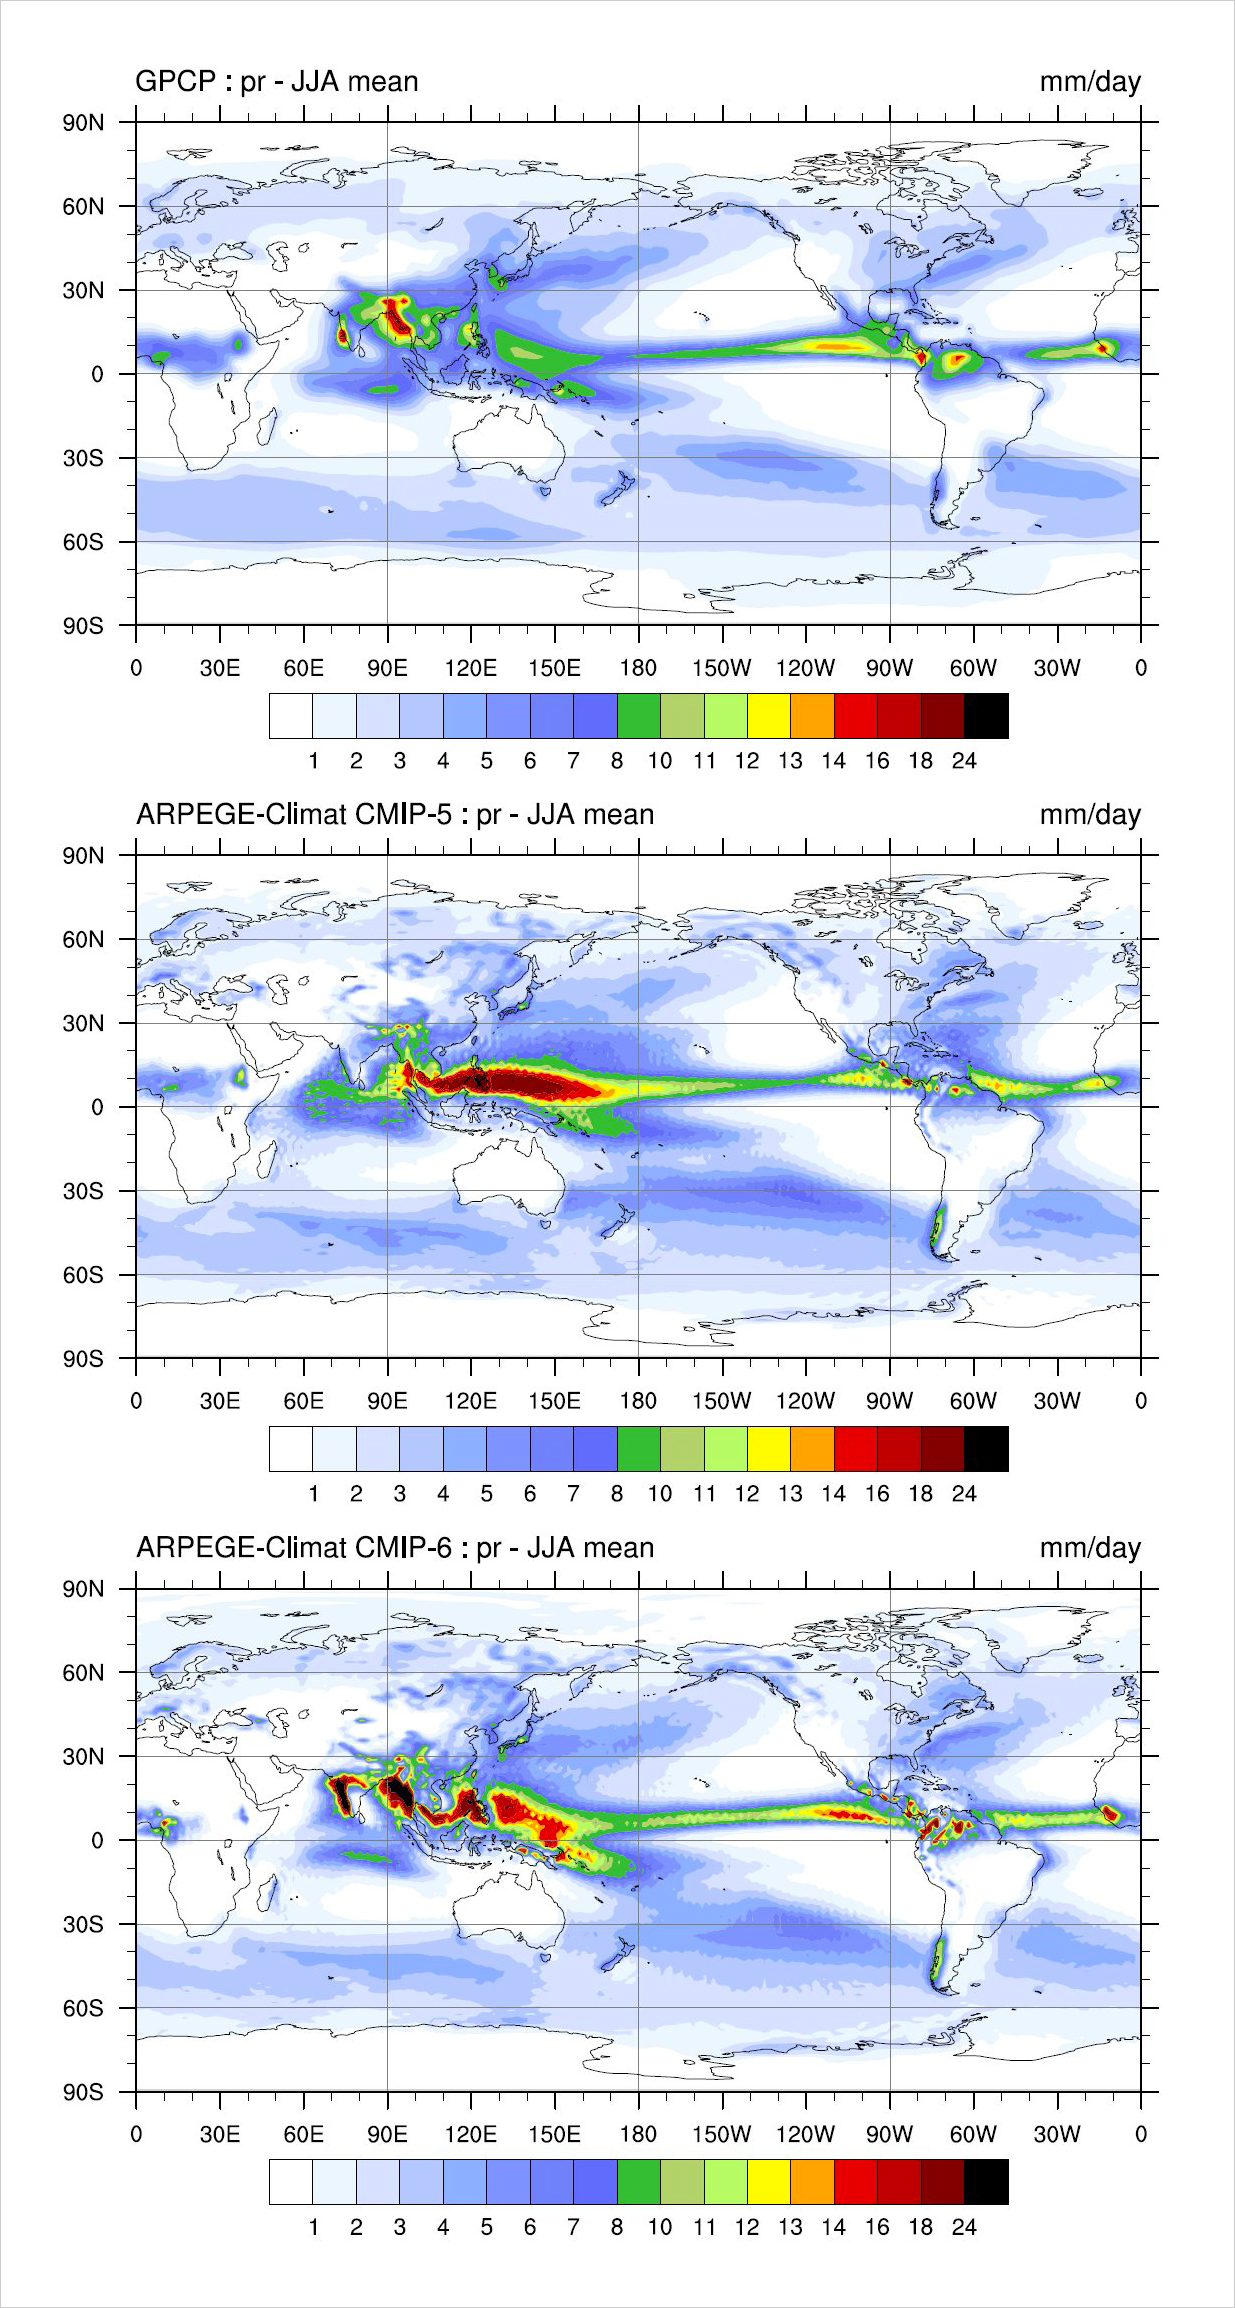
Average rainfall (mm/day) for the 1979-2008 period and June-July-August season: for the GPCP product (top) and for simulations using the ARPEGE-Climat version CMIP-5 (middle) and ARPEGE-Climat version CMIP-6 (bottom) performed by prescribing the ocean temperatures observed.
© Météo-France

The atmospheric general circulation model, ARPEGE-Climate, is a linchpin of the climate model of Météo-France’s National Centre for Meteorological Research (CNRM). At the end of 2016, version 6 of this model was finalized ready for coupling with a sea ice and ocean model, and will be used as the basis for the CNRM’s contribution to the Coupled Model Intercomparison Project (CMIP-6), the findings of which will inform the 6th assessment report of the Intergovernmental Panel on Climate Change (IPCC). This version incorporates a number of new features, developed at the CNRM over the past decade:

– a new convection diagram, coupled with detailed cloud microphysics, which continuously analyses deep and shallow convection schemes;

– the turbulence diagram more clearly depicts the limit layers;

– the one illustrating continental surfaces now describes the processes associated with aquifers and floodplains;

– lastly, the display of non-orographic gravity waves enables account to be taken of the sources linked to deep convection and the formation of atmospheric fronts

Compared to the previous version implemented for the CMIP-5, the model simulates in a much more realistic way, for example, the distribution of tropical rainfall (with excellent simulation of Asian summer monsoon rains, see illustration) or that of cumulus clouds over the tropical oceans and stratocumulus clouds on the eastern edge of subtropical oceans. The representation of the stratosphere has also been greatly improved, now, for the first time, featuring a realistic simulation of the Quasi-Biennial Oscillation, the regular variation of the winds that blow high above the equator.

Assessing the environmental quality of neighbourhoods for urban regeneration processes

Station mobile et portable pendant la campagne de mesures EUREQUA à Paris
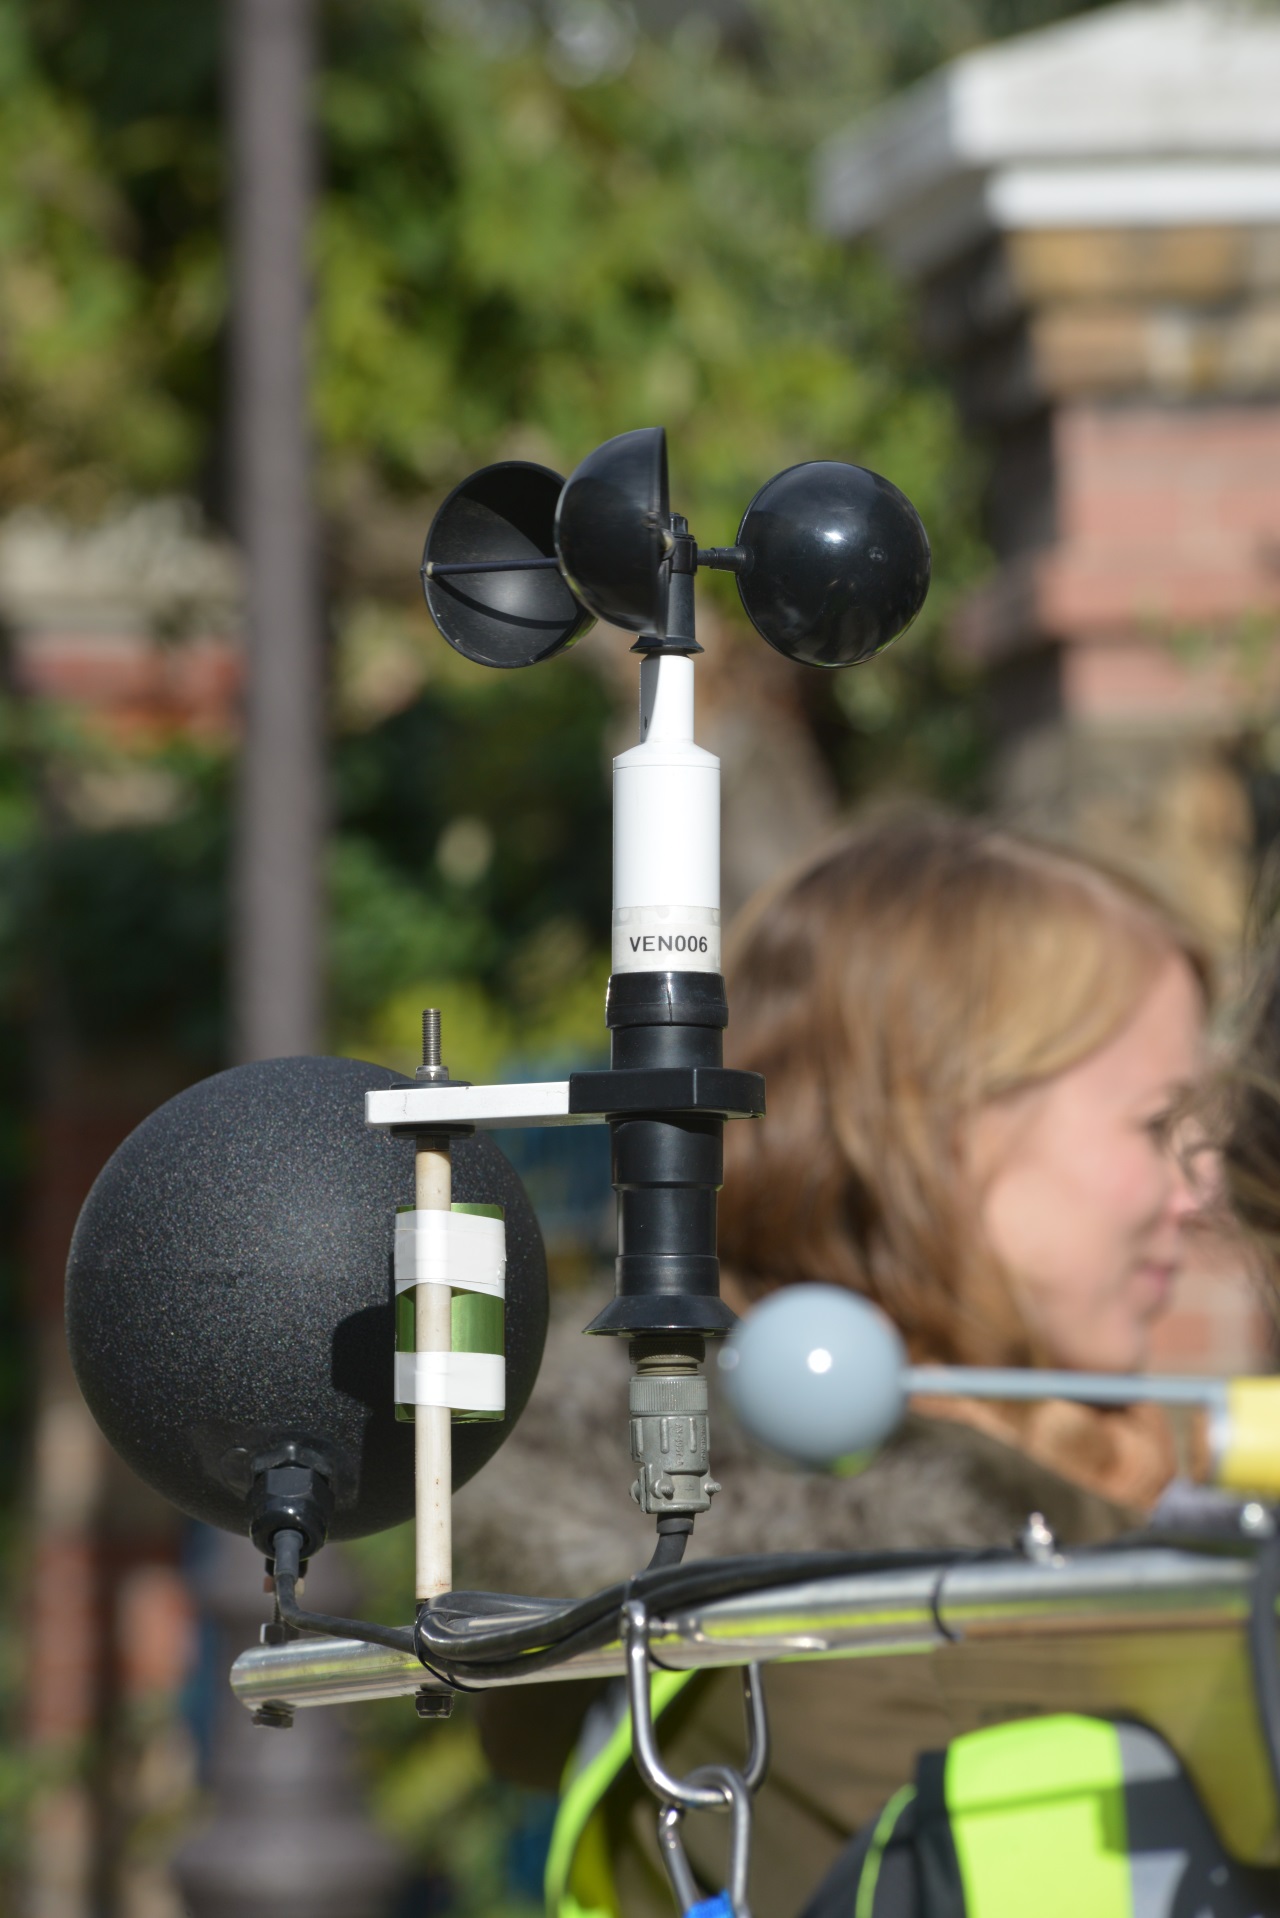
Portable, mobile station during the EUREQUA measurement campaign in Paris, Porte de Bagnolet, in the autumn of 2013. © Météo-France, Pascal Taburet

What the EUREQUA project sets out to do is analyse the environmental quality within a neighbourhood by cross-linking two approaches: measuring environmental parameters and collecting the perceptions and views of the neighbourhood’s residents and users.

The project team is working in three neighbourhoods where the environmental stakes are high in Toulouse, Paris and Marseille. The main site is a neighbourhood in Toulouse exposed to high noise and atmospheric pollution from the nearby road traffic. Itineraries making use of instruments and commentary were carried out in January, April and June 2014. At different locations around the neighbourhood, a survey was conducted among residents to assess several criteria: climatic comfort, background noise and air quality. At the same time, scientists collected mobile measurements bearing on microclimate, air quality and background noise.

This data was analysed using statistical approaches to understand the criteria on which residents base their assessment of the environmental quality of their living environments and whether measurements and perceptions match up.

Drawing on this experience, researchers and urban planning stakeholders are putting their collective thinking caps on to design a procedure to guide urban regeneration, grounded in the participation of residents and harnessing interdisciplinary expertise. The aim is particularly to come up with a streamlined forward-looking assessment protocol based on surveys and measurements, which is easy for the stakeholders to put into practice and can be supplemented with more specific measurements.

An international symposium entitled "Urban environmental quality: interdisciplinary and participatory approaches" has closed the project on 23-24 February 2017 in Toulouse.

Discover the other chapters of the current part