2.1

Ever more reliable
weather forecasts

Several new features in the forecasting chain

Determining the quality of forecasts in line with end users’ needs

Indice de qualité des températures du 16/09/2016 au 14/12/2016 (moy. sur 3 jours), rés. 12 HUTC, réf. ANA CLIM, échant. France . © Météo-France
Quality indicator of the temperatures between 16/09/2016 and 14/12/2016 (av. over 3 days), res. 12:00 UTC, ref. ANA CLIM, samp. France. © Météo-France

In 2016, Météo-France wanted to improve the quality monitoring of its forecasts by implementing an indicator that represented users’ needs even better than before. This now takes into account the most commonly used meteorological conditions for describing the weather: temperature, wind, cloud cover, rainfall, snowfall, storms or fog.

For each of these parameters, the percentage of "correct forecasts" is calculated at 1,300 geographic points across mainland France. The figure below shows the quality of temperature forecasts over the final months of the year: the very high quality of forecasts for the month of November was followed by a less reliable period in December, dominated by anticyclonic conditions where sudden changes in cloud cover and temperature are a common cause of forecasting errors.

Nowcasting: more detailed data

Prévision par Arome PI le 4 mai 2017 à 14h UTC pour le 4 mai 2017 à 16h30 UTC de la couverture en nébulosité basse (en pourcentage, en jaune : peu importante / en vert : totale), les précipitations prévues (en niveaux de bleu / violet) © Météo-France
Forecast by AROME-PI, on 4 May 2017 at 14:00 UTC for 4 May 2017 at 16:30 UTC, of low cloud cover (in percent, in yellow: not significant; in green: total), forecast precipitation (in blue/purple levels). © Météo-France

Forecasting what the weather will be like in the next few hours, or predicting how rapidly developing or high-intensity events, such as storms, will evolve, demands so-called “nowcasting” tools. Thanks to headway made in terms of NWP and the current capacity of supercomputers, it is now possible to obtain the first model forecasts less than half an hour after observations are made. Since March 2016, Météo-France has thus been equipped with the AROME-PI product chain, which runs hourly forecasts with lead times of up to six hours. Based on the NWP model AROME, AROME-PI provides more detailed datasets than the latter by incorporating the most recently observed data. The information currently utilized every 15 minutes concerns: wind at 10 m, the temperature and humidity of the air mass at 2 m, the sea level pressure, low cloud cover and precipitation (rain, snow, hail, etc.). Several summaries (indications of severe convection, fog, solid precipitation) are also available. There are also products in the process of being validated to extend, with these new inputs, the rain forecasts currently extrapolated from radar datasets.

AROME-PI is still being developed following initial feedback, but ultimately it will make it possible to fine-tune the temporal and spatial monitoring of hazardous weather events, such as extreme events around the Mediterranean. It is also intended to better aid the aeronautical sector as well as all customers who need to have a very accurate idea of the chronology of rainy spells for their work (road carriers and open-air event organizers for example).

The AROME forecasting model deployed Overseas

Réflectivité radar à 3 000 m, simulée par AROME-Indien, le 17 avril 2016 à 18 h, pour quatre échéances entre 11 h 20 et 21 h, autour du cyclone Fantala au nord de Madagascar. © Météo-France
Radar reflectivity at 3,000 m, simulated by AROME-Indien, on 17 April 2016 at 18:00, for four different time scales between 11:20 and 21:00, around Tropical Cyclone Fantala to the north of Madagascar. © Météo-France

In February 2016, five new NWP model configurations were deployed to cater for Overseas needs. Based on the AROME model, which is already in use on a broad scale across mainland France and Europe, these versions cover all of the tropical Overseas départements and territories: Antilles (Guadeloupe and Martinique), French Guiana, New Caledonia, the Indian Ocean (Reunion Island and Mayotte) and French Polynesia. They replace the configurations based on the ALADIN model hitherto used on the Overseas regions.

With a horizontal resolution of 2.5 km, these tropical versions of AROME accurately represent the often complex terrain of these regions, as well as the life cycle of convective clouds that form there. They particularly improve Météo-France’s ability to predict and monitor the development of cyclonic events. Accordingly, during the powerful cyclone Fantala, which swept through the Indian Ocean in April 2016, AROME was used to model the cyclone’s eyewall “replacement cycle” for the first time for this area.

During this process, a new eye gradually forms around the old eye, weakening and replacing it. The cyclone eventually takes on a single-eye structure, but with a larger diameter. This phenomenon causes variations in the cyclone’s intensity and widens the zone impacted by very strong gusts of wind. Being able to predict this phenomenon is therefore essential during cyclone watch activities.

From 2017, these AROME configurations will benefit from new improvements, not least the addition of a one-dimensional ocean model that will enhance ocean-atmosphere interaction modelling.

Five new NWP model configurations were deployed to cater for Overseas needs.

After the mainland, next stop for coastal wave modelling: Antilles and French Guiana

Carte de hauteur des vagues de la mer totale le 16/09/2010 à 12 h UTC sur la Guadeloupe.
Global significant wave height (m) of WW3 on 16/09/2010 at 12:00 UTC over Guadeloupe. The purple arrows show the direction of the swell from Tropical Cyclone Igor (category 4) circulating 600 km to the North-East. The height variations reflect the impact of the breaking and dissipation of energy due to the refraction and the seabed. © Météo-France

At the end of 2015, the second phase of the HOMONIM (Recording, observing and modelling of sea levels) project led by Météo-France and the Naval Hydrographic and Oceanographic Service (SHOM), was launched with the support of the Ministry of the Environment, Energy and Marine Affairs to improve forecasting tools for storm surges and coastal waves, particularly Overseas. This stage followed on from the establishment, for the mainland, of the high-resolution coastal wave model WaveWatch 3 (WW3) in March of the same year.

After bathymetric studies and various grid-mesh tests, followed by a validation stage, it was the turn of this WW3 model’s configuration for the Antilles and French Guiana to be set up in December 2016. The WW3 model provides parameters describing the marine conditions at a resolution of 200 m near the French coasts, and is unique in employing an irregular grid-mesh to be able to adapt its grid to the outline of the coasts. It is forced by winds of the atmospheric model AROME-Overseas, at a resolution of 2.5 km, and inserted into Météo-France’s regional wave model MFWAM, at a resolution of around 10 km.

In shallow water, WW3 is better at modelling processes linked to bathymetry, the nature of the seabed and the coastline than the MFWAM model. Around French Guiana, the consideration, in the near-term, of surface currents and, in the longer-term, of the mud sediments on the sea floor, should improve the simulation of sea states that much more.

WW3 configurations for Mayotte and Reunion Island are due to be deployed by the end of 2017.

Advancing understanding and forecasting of high-impact weather events

Extreme events around the Mediterranean: the HYMEX programme

Lâcher de ballon durant la campagne HYMEX les 25-26 novembre 2012 à Montpellier. © Météo-France, Pascal Taburet.
Balloon release during the HYMEX campaign on 25-26 November 2012 in Montpellier.
© Météo-France, Pascal Taburet

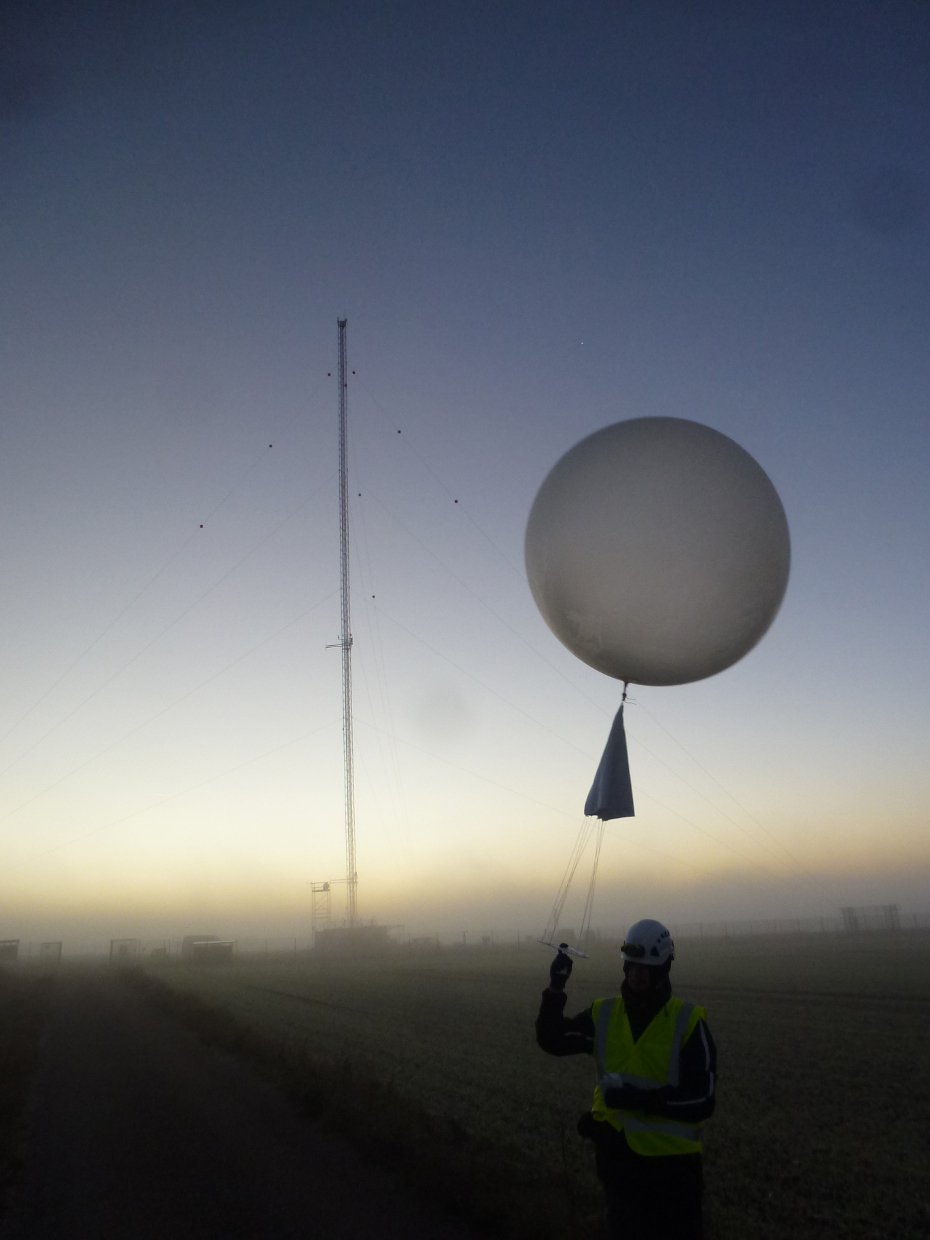
If we are to improve our forecasting of hydrometeorological hazards around the Mediterranean, we need to understand the water cycle in this area. Launched in 2010 with a view to more accurately predicting extreme events in the region, the HYMEX programme, jointly coordinated by Météo-France and the CNRS, has delivered a set of findings from an analysis of observations collected during the 2012 intensive measurement campaign when more than 200 research instruments (including aircraft, vessels, balloons, radiosonde systems, gliders, buoys and floats, radars and wind profilers) had been put into use. After three years of analyses, the main findings were published in August 2016 in a special issue of the Quarterly Journal of the Royal Meteorological Society. A series of 31 articles, coordinated by Météo-France researcher Véronique Ducrocq, the CNRS and Italian, Spanish, German and Swiss research labs, presents a wide range of findings and insights regarding Mediterranean episodes, their forecasting at different temporal scales and their observation.

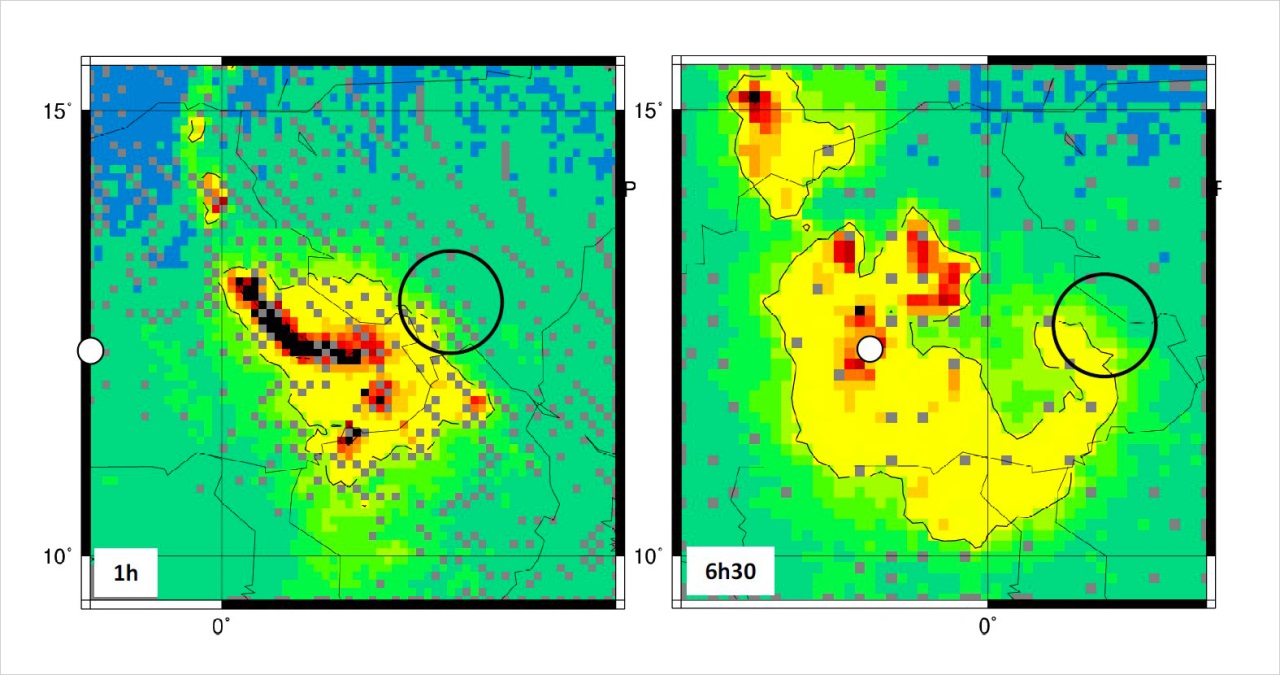
From the observations made during the programme in the autumn of 2012, it was also possible to monitor the development of several heavy rain spells in the Var. To gain a clearer idea of the physical processes at work, numerical simulations of these episodes were run using the research model developed by the French scientific community, Méso-NH, at a mesoscale horizontal resolution, and compared against the observations of the HYMEX field campaign. This not only showed the realism of the simulated precipitations and associated convective processes, but also explained the location of heavy rainfall by identifying the respective roles of low-level moist marine flow and possible dry air layers aloft, the terrain of the Mediterranean area and islands and, lastly, convective processes.

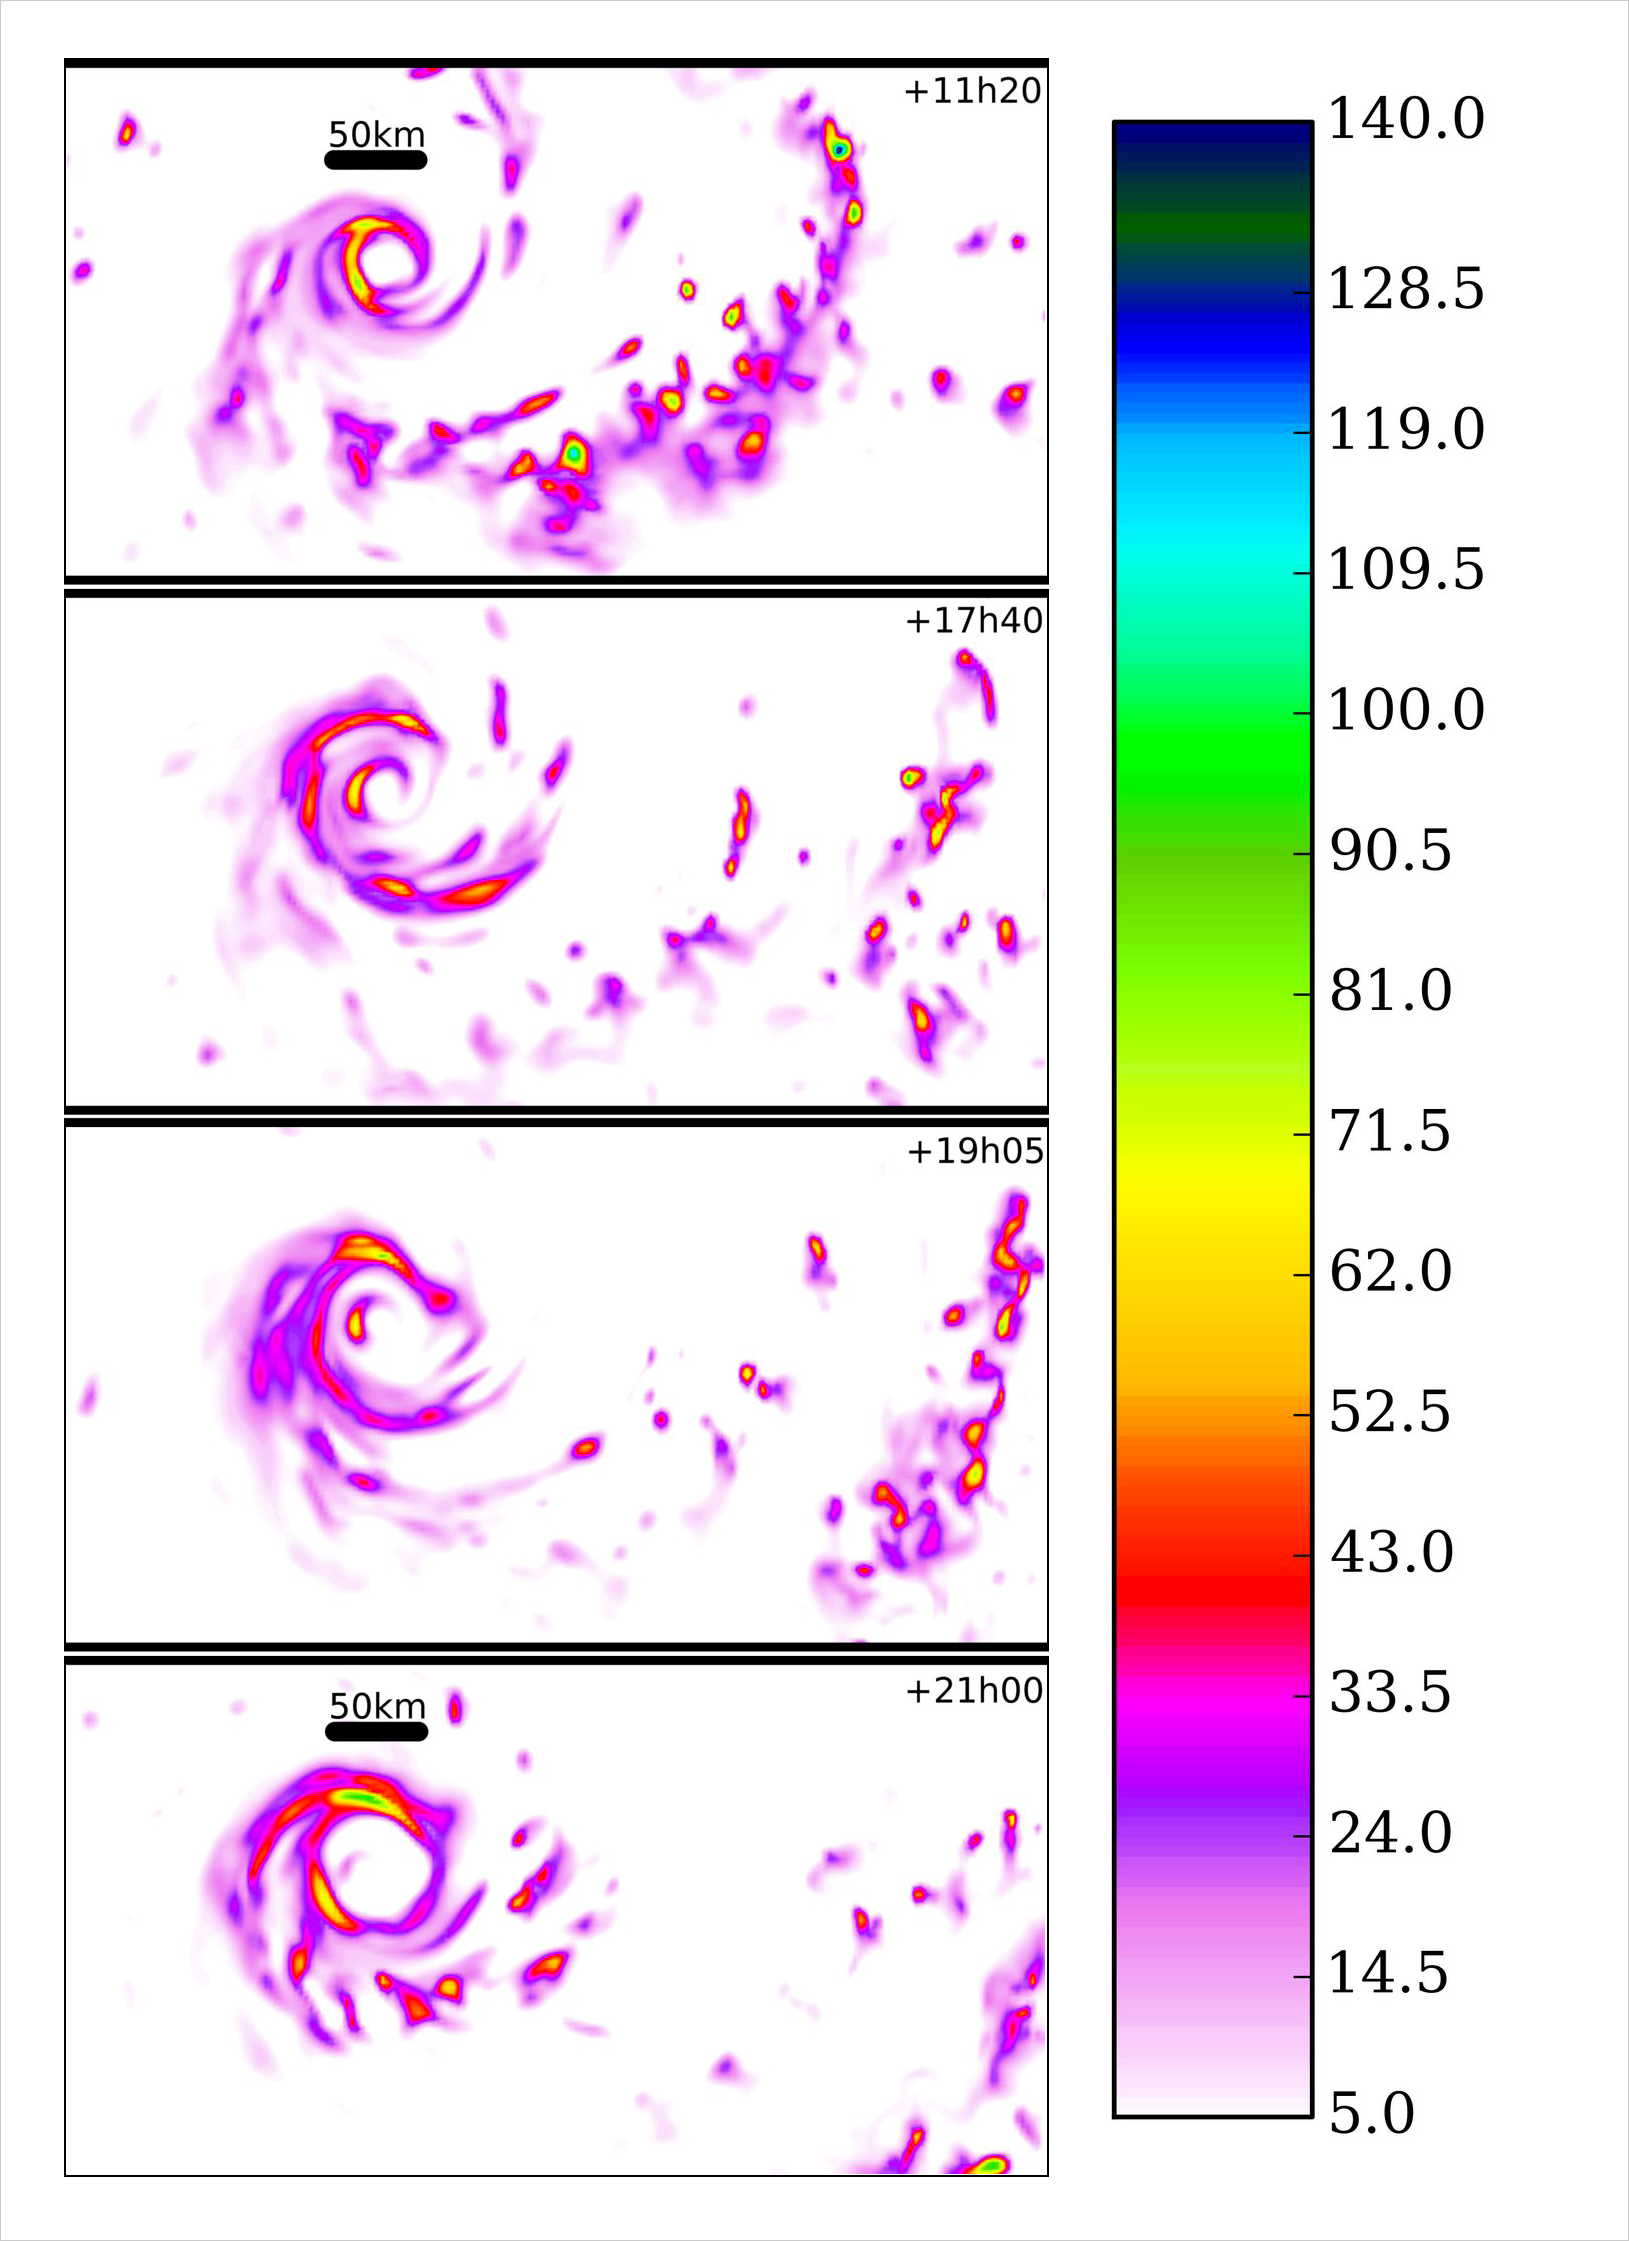
To delve deeper still into the workings of such processes, continuing research at the CNRM as part of the HYMEX programme and ANR MUSIC project is now simulating this region at a particularly high resolution. The first simulations at 150 m of horizontal resolution are currently being analysed. Findings from this research will serve as a benchmark for improving modelling of convective phenomena in Météo-France’s NWP systems and pave the way for future versions of these systems at sub-kilometre resolutions.

Extreme rainfall in Africa: the THORPEX programme

Intensité des précipitations à Ouagadougou
Intensity of precipitation in Ouagadougou, 1 September 2009, at 01:00 and 06:30.

Africa is often exposed to extreme, high-impact weather events. A key area of scientific endeavour is therefore to improve our understanding of them, study of their predictability and forecasting of them. The WMO’s THORPEX programme (THe Observing system Research and Predictability EXperiment), in which Météo-France is involved, has chosen as a case study for West Africa the heavy rainfall event that caused severe flooding in Ouagadougou, Burkina Faso, on 1 September 2009. On that date, the largest rainfall ever recorded was reported for the Sahel, at 263 mm, wreaking widespread damage and human suffering. Together with forecasters in Senegal (ANACIM), a detailed multi-scale analysis was performed of this case, and showed that the event did not match up to the squall lines usually observed over the Sahel, associated with intense rainfall and gusts of wind, but which dissipate too fast for a significant amount of monsoon rain to build up. The night before the event, a mesoscale cyclonic whirlwind had pivoted an initial squall line, turning it into a broader turbulent band of rain, in the shape of a comma, moving slowly over Ouagadougou. The study identified the drivers for this extreme event to come about – not least the passage of African Easterly Waves combined with a strong and broad moist anomaly which begun over East Africa. At a larger scale, the interaction between several equatorial waves was revealed, which would have been conducive to this type of event.

By identifying and understanding all these drivers, we have demonstrated the predictability of such events and therefore our ultimate ability to forecast them.

Field measurement campaigns to shed light on how fog forms

Lâcher de ballon pendant la campagne de mesure du brouillard, en automne 2016, dans la Meuse.
Release of a radiosonde system during the fog measurement campaign, in the autumn of 2015, in the Meuse. © Météo-France, Frédéric Burnet

Fog has a significant impact on the safety of people and on the economy – particularly the aviation industry. At airports for example, it disrupts aircraft takeoff and landing times. But forecasting the location and life cycle of fog layers remains a challenge as, to do so, its microscopic properties need to be taken on board. In an attempt to improve fog forecasting and modelling, Météo-France conducted two field campaigns over the autumns of 2015 and 2016, working in partnership with the IRSN (French Institute for Radiological Protection and Nuclear Safety). Performed at the atmospheric station of the Long-Term Environmental Research Monitoring and Testing System (OPE) in Houdelaincourt (Meuse), using a major instrumental facility, these campaigns set out to achieve the following:

– document the characteristics of the vertical profile of the microphysical properties of fog (number and dimension of water droplets, liquid water content and visibility) for the purposes of forcing and validating numerical simulations;

– assess the contribution made by the assimilation of humidity and temperature profiles supplied by microwave radiometers for forecasting fog;

– factor in the turbulent liquid water flux on vegetation, which does not currently feature in the models.

Sensors were fitted at different altitude levels (2, 10, 50 and 120 m) and vertical profiles carried out in situ up to 500 m with a tethered balloon. With these datasets it will be possible to explore the variability of different parameters across the fog layer and, ultimately, to improve the representation of fog in numerical models.

Avalanches: exploiting satellite data

Cartographie de dépôts d'avalanches près d'Aragnouet dans les Pyrénées, en mars 2015.
Mapping of debris avalanche deposits near Aragnouet in the Pyrenees, March 2015.

Paramount to snowpack stability studies is the ability to locate and estimate the size of avalanche debris, for this enables us to assess and improve physical models for forecasting the avalanche risk and thus to pinpoint at-risk periods and zones with more accuracy. In the longer term, having such uniform observations to hand would also be invaluable for analysing the development of natural avalanche activity in connection with climate change. And yet, the databases currently available primarily contain simple visual observations carried out across the territory.

Since 2016, Météo-France has been examining high-resolution satellite data to study the snowpack and avalanches in particular. The European Space Agency-operated Sentinel-1 satellites can now be used to scrutinize the snowpack at a compatible spatiotemporal resolution with the remote detection of avalanche deposits. The identical twin satellites Sentinel-1A (launched in 2014) and Sentinel-1B (launched in 2016) observe the French mountain ranges using a C-band SAR (Synthetic Aperture Radar), which operates over land at 20 m spatial resolution and has a repeat cycle of 6 days. In places where an avalanche has occurred, the snow presents different characteristics (height, density, roughness, etc.) from those observed in the undisturbed surrounding areas, which changes its presentation in the SAR measurements. Detection is possible by the resulting high variations in backscatter coefficients.

An algorithm for detecting avalanches has been developed this year by Météo-France and tested successfully in the Alps and Pyrenees (see Figure); it could be automated in the near future. Moreover, a mapping database of avalanche debris is currently being put together from these results (identification of events since the winter of 2014-2015), and will go a long way towards improving forecasting – particularly during red or orange weather warning periods.

Quantifying uncertainty over forecasting: a challenge for the future

Ensemble forecasting: what are the benefits?

Petite objet avec nuage

Users of Météo-France services are becoming ever more demanding when it comes to the temporal and spatial accuracy of forecasts and, as such, the institution is working tirelessly to improve its forecasting systems – particularly its fine-mesh model. But some element of uncertainty still persists for all that, given the errors inherent in numerical prediction calculations and measurements (even if these are steadily being reduced), and will continue to do, including for short-range forecasts. So one of the challenges facing us today is to quantify this uncertainty.

This is possible using the so-called ensemble forecasting method which, rather than making a single forecast, produces a set (or ensemble) of forecasts, by varying the initial hypotheses within the limit of the measurement or modelling errors. The outcome of the different simulations outlines the range of possible scenarios and informs on the likelihood of each one. If they are all exactly the same, confidence in the forecast is high. If the spread of the ensemble forecast is large, however, the forecast is uncertain. Forecasting scenarios are then organized/ranked in order of decreasing probability.

Météo-France already applies this method to weather forecasting and is endeavouring to develop it for other phenomena: avalanches, storm surges and flash floods.

Application of ensemble forecasting to avalanche hazard warning: a world first

Graphique de hauteur de neige du 26/02/2016 au 01/03/2016 dans le massif du Mercantour

Graphique d'indice de risque naturel le 26/02/2016 pour le massif du Mercantour
PEARP-S2M forecasts initiated on 26/02/2016, in terms of snow height and composite indicator of the risks of a spontaneous avalanche occurring (from 0 to 8). These forecasts have enabled reliable anticipation of abundant snowfall which has actually been observed in practice over the Mercantour mountain range (between 50 and 80 cm in 48 hours), as well as of the associated avalanche risks. The spread increases beyond 2-day ranges, because of uncertainty over the chronology of the activity of this "Easterly" type disturbance. © Météo-France
Carte de vigilance, indices de risque d'avalanche pour le massif du Mercantour du 26/02/2016 au 01/03/2016
Chronology of the event over the Mercantour mountain range: weather warning chart, risk indicators of the Bulletins estimating the risk of an avalanche and significant event.
© Météo-France

Predicting changes in snowpack is a complex task. This is because the latter is very sensitive to meteorological conditions and a host of threshold effects, such as the variation in the rain-snow line.

The snow science modelling chain S2M (SAFRAN - SURFEX/ISBA-Crocus - MEPRA), which retrieves meteorological forecasts from the ARPEGE model, plays a part in drawing up next-day avalanche hazard forecasts (such as reports estimating the avalanche hazard and avalanche warnings for example). Its reliability varies depending on the situation.

To take an objective approach to estimating the confidence forecasters can have in a given forecast at a given time, and in a bid to push back the forecasting lead time, the Snow Research Centre (Météo-France/CNRS) has developed a snow numerical “ensemble” forecasting system: a world first.

With the ARPEGE ensemble forecasting model as its data source, this system was tested in real time through the winter of 2015-2016. It improves the overall reliability of simulations and the anticipation of high-impact events – including for 3- to 4-day lead times.

Anticipating Mediterranean flash floods more reliably through ensemble forecasting

Dessin d'un réveil

Predicting the location and intensity of heavy rainfall in the Mediterranean regions as well as the hydrological response of the areas concerned is a major scientific challenge. An original integrated approach, taking on board meteorological and hydrological forecasting uncertainties, has been developed since 2007 at Météo-France’s National Centre for Meteorological Research for predicting the flow of fast-changing rivers. This draws on rainfall scenarios from the AROME high-resolution ensemble forecasting system. For hydrological simulations, it is grounded in a method bearing on disturbances in initial soil moisture and the sensitive parameters of the ISBA-TOP hydrological model dedicated to simulating rapid rises in water levels, in order to obtain a hydrological ensemble.

This flow ensemble forecasting system enables the anticipation of flash floods further ahead of time and the forecast’s level of uncertainty to be gauged.

The operational outlook now concerns very short forecasting lead times of around 3-4 hours, providing enough warning for emergency crews to intervene in the event of a crisis.

Probabilistic predictions of storm surges

Graphe de prévision d'ensemble de surcotes pour La Rochelle lors de la tempête Doris du 9 mars 2016
Temporal ensemble forecast chart of storm surges for La Rochelle during Storm Doris, dated 9 March 2016, launched on 6 March at 18:00 UTC. The observation of the storm surge is indicated by the solid red line, while the ensemble forecast of storm surges is shown in the form of box and whisker plots. The orange line shows the non-disrupted component of the ensemble and the green line the deterministic forecasting launched on 6 March at 18:00 UTC. © Météo-France

Accurately predicting sea levels is a key challenge for the "Vague Submersion” (storm surge flood) warning service set up in October 2011. The HOMONIM (Recording, observing and modelling of sea levels) project is being conducted with the Naval Hydrographic and Oceanographic Service (SHOM) on behalf of the General Directorate for Risk Prevention (DGPR) and General Directorate for Civil Safety and Crisis Management (DGSCGC). Its aim is to improve the ability to forecast coastal flooding and, in this context, Météo-France developed a storm surge model which has been in use since January 2014. A new probabilistic version has come about since, commissioned on 5 July 2016.

Twice a day, this ensemble forecasting of storm surges uses the wind and pressure parameters of the ARPEGE ensemble prediction model as atmospheric forcing for the deterministic storm surge model.

Work on this application will continue through efforts to optimize the way results are displayed (graphs, derived calculations to support decision-making) and to use other types of atmospheric ensemble prediction, such as those based on Météo-France’s AROME model, or the IFS model developed by the European Centre for Medium-Range Weather Forecasts.

Discover the other chapters of the current part

2.2 Climate : tapping into data from the past to anticipate changes in the future